
Powerlifting Data and Exploratory Data Analysis Part 1
A few weeks ago I found myself searching for lifting data on the Internet. I have always enjoyed working out and I wondered if there were any viable datasets out there, which quantified one of my hobbies. Then I stumbled upon OpenPowerlifting’s powerlifting database. OpenPowerlifting houses data on over 300,000 lifts completed at powerlifting meets across the country. I quickly found myself searching for well-known powerlifters like Mark Bell, Brandon Lilly, Stan Efferding, and Jonnie Candito. After finding those big hitters, I searched for friends in the dataset as well *cough*AlanZhou*cough*. I was happy and intrigued with the data collected by OpenPowerlifting. I decided that when I had time, I would revisit the dataset and see if there was anything I could do with it.
Here is what OpenPowerlifting has to say about their data: “The OpenPowerlifting project aims to create a permanent, accurate, convenient, accessible, open archive of the world's powerlifting data. In support of this mission, all of the OpenPowerlifting data and code is available for download in useful formats. There is no need to scrape this website.” Having spent days scraping websites in the past and deciphering badly written HTML code, I was glad to have found a readily downloadable CSV file on OpenPowerlifting’s Github.
I was ecstatic that other data engineers, data scientists, software developers, and data analysts enjoyed powerlifting. The folks behind OpenPowerlifting and I have two things in common, lifting and data science. I decided to put the timer on for a half hour and see what I could do the data. I implemented this time limit simply because I could see myself spending an inordinate amount of time with the data and I had other, more pressing deadlines to meet.
The tables below are simple breakdowns of the big three lifts. I split the data into male and female groups. Additionally, I have included the total and the Wilks Coefficient averages.

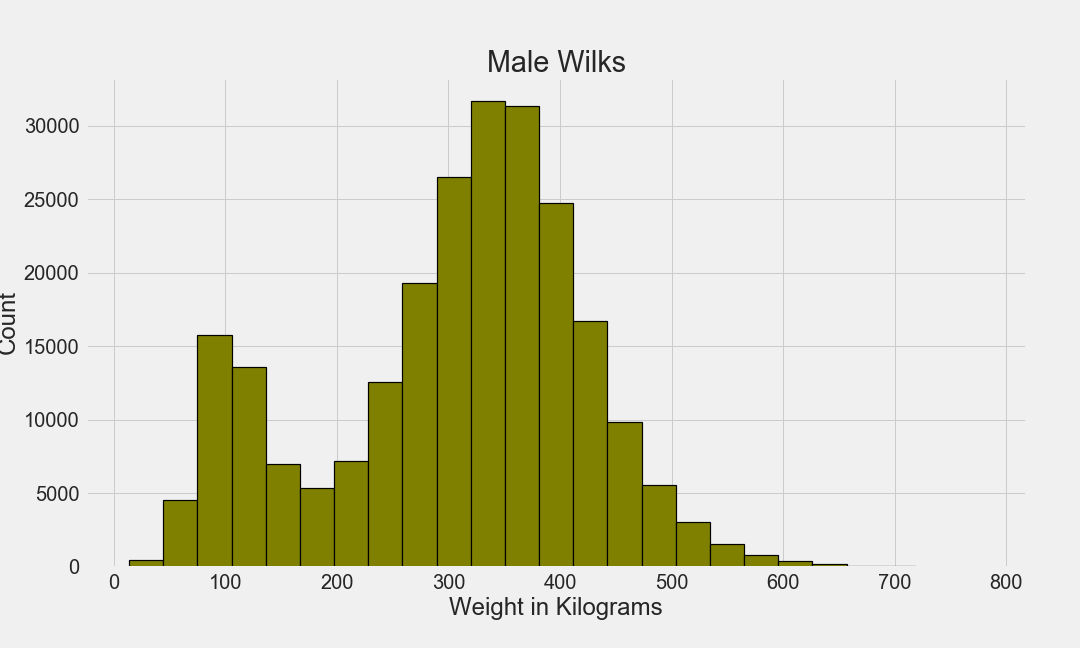
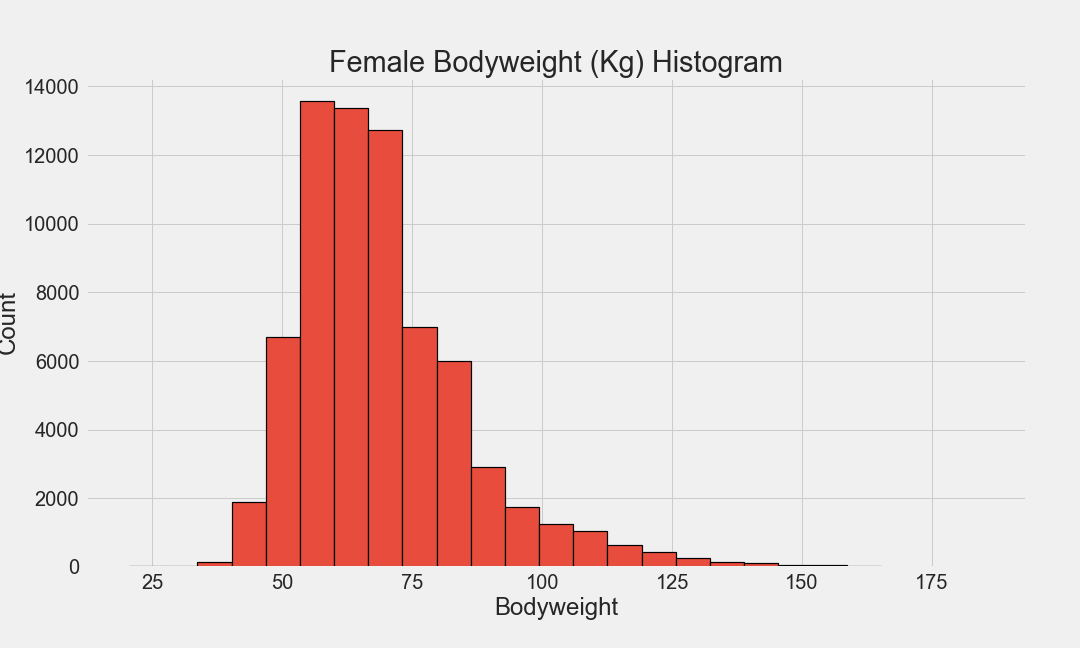
Now, I will say that some of these measurements seemed a bit off to me. I plotted the histograms in order to get a better sense of the distributions and I have included them below. The age distribution for powerlifting was particularly promising. We are seeing a large number of young folks joining the sport and competing. This could be due to the popularity of YouTube fitness celebrities like Mark Bell, Omar Isuf, Silent Mike, Barbell Brigade, and Candito Training HQ. Hopefully, this trend continues in the future.


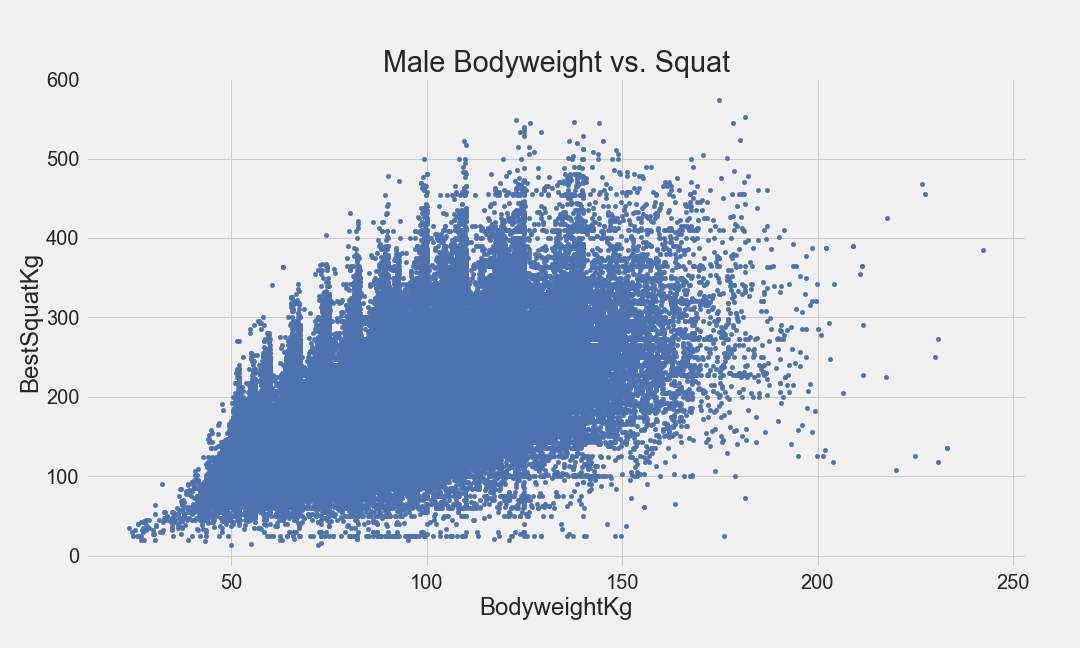
Looking at the scatter plots of both men and women indicate positive correlations between bodyweight and lift weight. This was a no brainer. But based on these scatter plots, I believe a one unit increase in bodyweight increases a person’s bench the least and deadlift the most when compared to a squat. I will attempt to prove (or disprove) this hypothesis in part two of this analysis. The reason I have broken this little project into two parts was because I accomplished very little work by the time my thirty minutes were up. I plan on doing some actual machine learning in part two, so stay tuned!


I will make my Jupyter Notebook publicly available on my Github once I finish up my analysis. Below are the links to OpenPowerlifting.

